NEWSLETTER

In December, we focused on strengthening the product across reliability, workflow, and research: we added a robot health-check service, updated the app-wide UX with the Universe Screener as the central workflow hub, launched the documentation portal, advanced R&D on VIX-themed implied volatility estimation, and continued refining our LSTM-based price/return prediction model.
- The Universe Screener is now the central hub of the app, supported by a modern, dashboard-style UI across the platform.
- Platform documentation is now available from the main website via the Help Center.
- The automated health-check service reduces detection time and speeds up response to service disruptions.
- Our R&D work is now more visible through the Newsletter and Help Center.
- Additional refinements and small improvements were made across the platform.
Platform updates
We are expanding into offerings that include derivative products with an options-based downside protection strategy designed to help investors build a portfolio-specific set of instruments that can provide protection against severe drawdowns.
To refine volatility estimates, we are developing a VIX-inspired method for estimating implied volatility, a forward-looking indicator of risk. We plan to use implied volatility in reporting, since many portfolio managers view it as more informative than purely history-based measures. We will also incorporate these forward-looking estimates into our asset allocation logic to support more risk-aware capital allocation.

Analytics in Practice
Our goal is to build a focused US Financials basket for broad sector coverage that is not riskier than the overall equity market. Using the Universe Screener (Custom tab), we define “slices” of the market by combining country, benchmark, and sector filters, as shown in the table below (US Financial Services is drawn primarily from IXF, with a small complement from S&P 100 Financials). We constrain the basket's beta to 1.0, ensuring the idea delivers broad Financials exposure without taking on more systematic risk than the overall market.
We transfer Idea A from the Universe Screener into a new portfolio and apply allocation guardrails to preserve diversification. Position weights are constrained to 2%–12% (0.02–0.12), preventing holdings from becoming immaterial or overly concentrated contributors to risk. The portfolio is titled US IXF SP100.
We then run the portfolio through the Asset Allocator to optimize weights under our selected constraints. For risk, we use a constant-correlation historical covariance matrix, and for expected returns we use Fama-French Five-Factor return estimates (defaults).
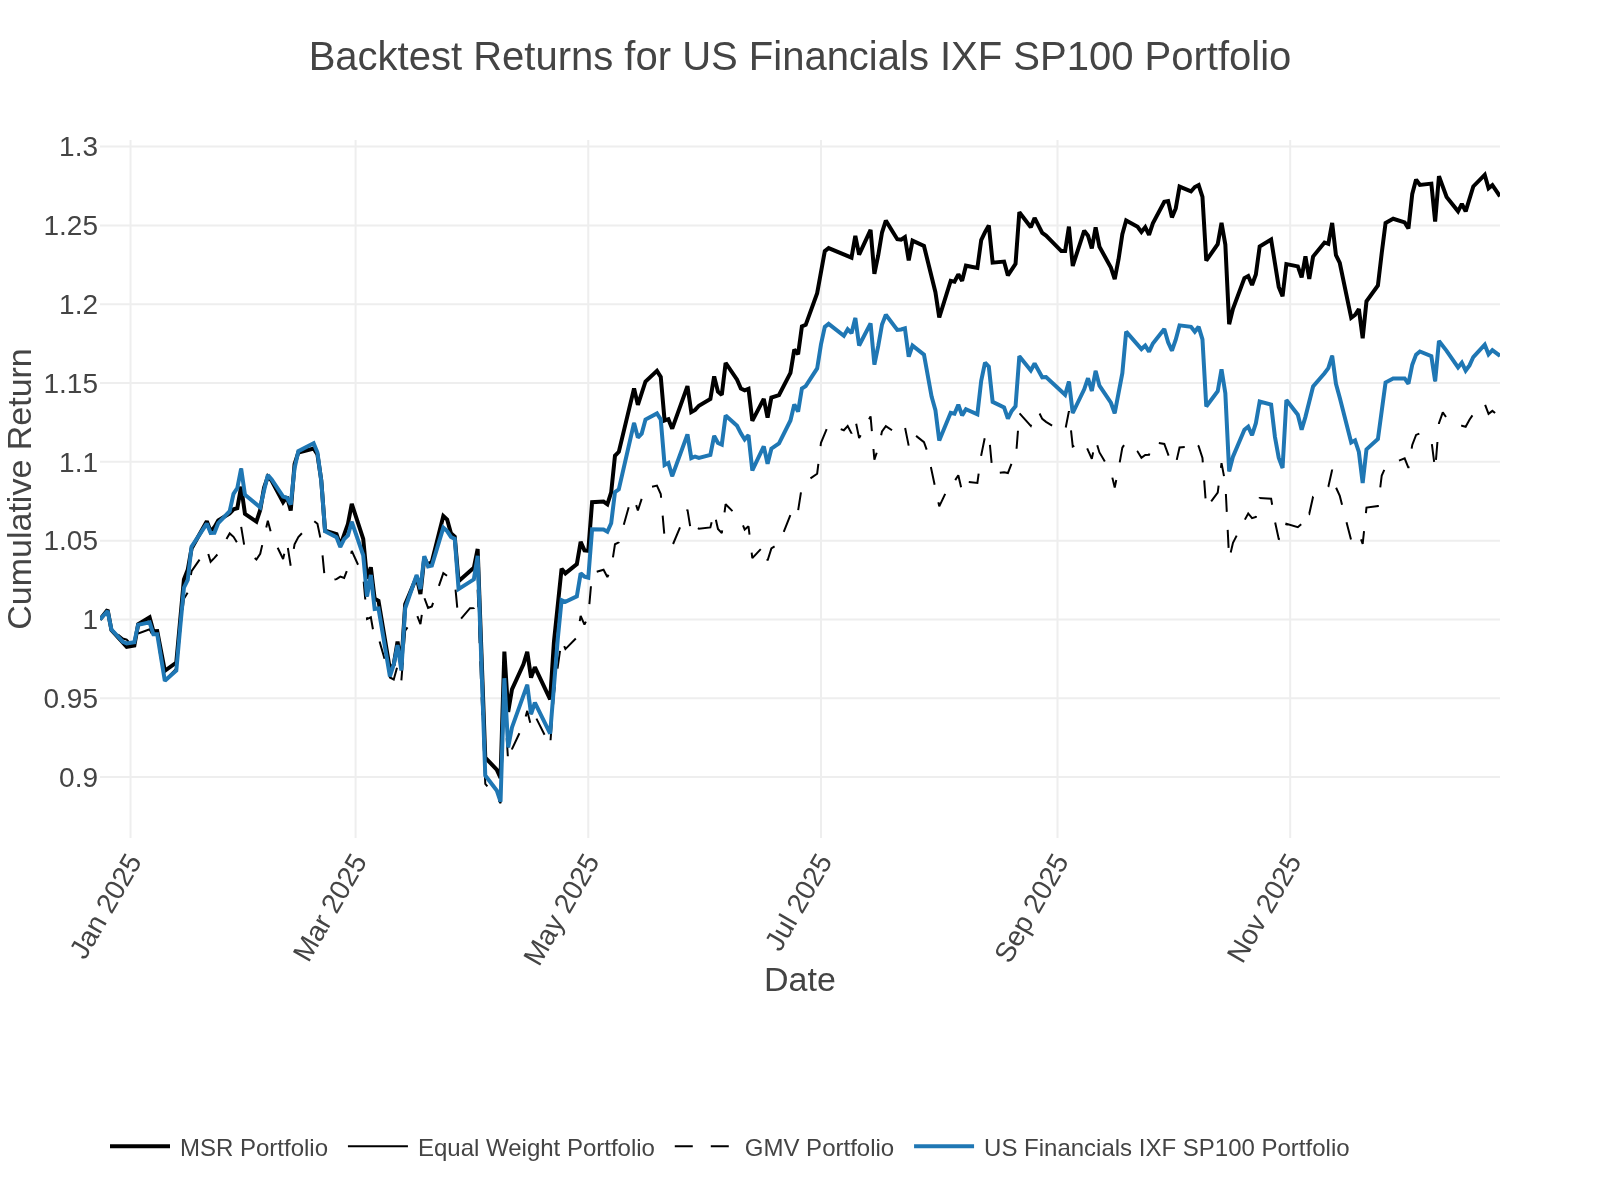
The chart compares cumulative performance over the last 252 trading days for the US IXF S&P100 portfolio under four weighting approaches: the baseline basket (blue), identical to the equal-weight portfolio in this case, Global Minimum Variance (GMV), and Maximum Sharpe Ratio (MSR). All series start at 1.0 and track through the same market swings, but diverge as weighting choices change the path of returns. Over this window, the MSR portfolio ends with the highest cumulative return, while GMV shows the most conservative profile, illustrating that portfolio construction can materially affect outcomes even when the underlying holdings are identical.
In conclusion, this example shows how InvestLens turns a broad investment objective into a repeatable, decision-ready workflow: we define transparent universe slices, identify an idea that respects a market-risk beta constraint, and then translate it into an implementable portfolio using optimized weights under clear allocation bounds. The backtest illustrates that weighting choices meaningfully impact performance, reinforcing why disciplined portfolio construction matters as much as asset selection.