NEWSLETTER

In February, we reached an important milestone. GM Advisors has evolved from a corporation led by a single director into an organization guided by four leaders with complementary expertise in AWS infrastructure, machine learning, and mathematics. We are proud to report that our board now has the R&D depth to take on our most ambitious projects. For InvestLens, this means greater transparency in our modelling and higher standards of rigor.
- The performance report across portfolios and assets has evolved into a dynamic performance comparing tool supporting up to 4 items as columns.
- Our ChaiTech participation brought more exposure of the product. InvestLens is acquiring first testimonials as we prepare for investment pitch in March.
- Additional refinements and small improvements were made across the platform.
Platform updates
We are excited to share that we received an additional Amazon Web Services grant to develop an InvestLens agent that can intelligently orchestrate the tools we have been building across the platform. Unlike many AI-first products that rely on opaque, AI-driven outputs, we are designing this experience around human accountability and expert oversight: the agent will operate within strict guardrails and will only invoke tools that have passed rigorous validation. Our goal is to deliver a financial advisor-style experience that feels safe, transparent, and convenient to use from home or the office, and we are targeting a working prototype within the next several months.

Analytics in Practice
This month we describe a short workflow that would resonate with many retail investors. Specifically, we will be reviewing our baseline US IXF SP100 portfolio and compare it with the corresponding Maximum Sharpe Portfolio, using the new performance comparing tool (see related analysis in February).
The baseline portfolio (US IXF SP100) is presented as an equal-weight basket across twelve holdings, spanning insurance/financials and related names (e.g., ACGL, BHF, CASH, CINF, FITB, HOOD, IBOC, OZK, PYPL, QFIN, SCHW, SLM).
The Maximum Sharpe Portfolio materially reallocates away from equal weight, concentrating into higherweight positions (ACGL, CASH, CINF, HOOD, IBOC, SLM at 0.120 each) while reducing exposure to others (BHF and PYPL at 0.020, QFIN at 0.033, with smaller weights for OZK and FITB). In effect, the optimizer is emphasizing holdings that contributed more favorably to risk-adjusted performance.
Over the tested window, the optimized portfolio improves the annualized return (0.213 → 0.267) while volatility slightly declines (0.244 → 0.238), producing a higher Sharpe ratio (0.734 → 0.928). Downside risk metrics also improve modestly (VaR and CVaR at 5%), and drawdown is slightly smaller (-0.207 → -0.193), suggesting the improvement is not simply higher returns achieved by taking more overall risk. You can also see the backtest results (since September, 2025) in the Figure below, where the Maximum Sharpe Portfolio (black) shows superior performance relative to the baseline (blue).
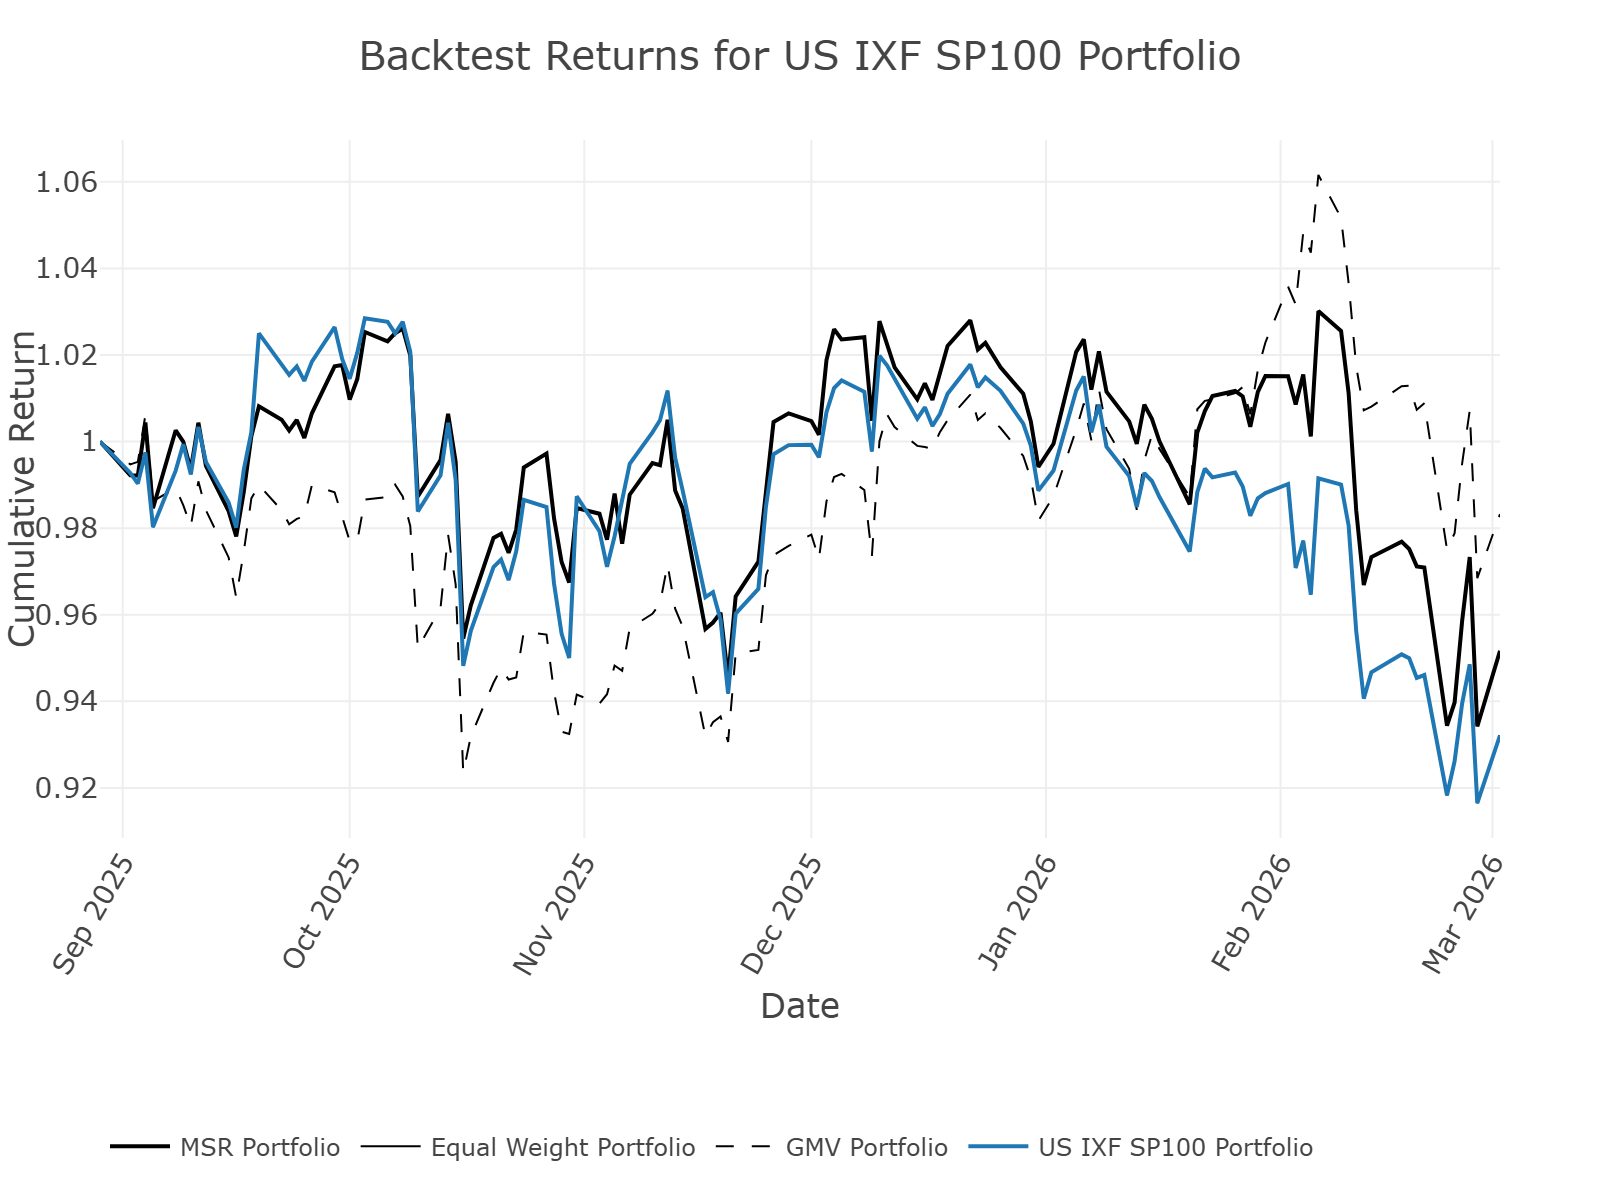
In conclusion, this example demonstrates how InvestLens’ new performance comparing tool helps investors quickly appreciate the impact of the optimized portfolio over the originally proposed baseline.